
psy.cl 🩸. Designing an unconventional period-tracking platform.
psy.cl 🩸. Designing an unconventional period-tracking platform.
psy.cl 🩸. Designing an unconventional period-tracking platform.
psy.cl 🩸. Designing an unconventional period-tracking platform.
psy.cl 🩸. Designing an unconventional period-tracking platform.
psy.cl 🩸. Designing an unconventional period-tracking platform.
psy.cl 🩸. Designing an unconventional period-tracking platform.
Duration
Sep 2022 - July 2023
Team
AJ Kim — PM
Katharine Bonilla — Tech Lead
Victor Xie — Tech Lead
Team
AJ Kim — PM
Katharine Bonilla
— Tech Lead
Victor Xie
— Tech Lead
Role
Design Lead
Tools
Figma
Paired with this passion project as a freshman at Rice's competitive web apps club, RiceApps! Now Head of Design @ RiceApps.
Worked with 10+ developers, tech leads, PMs, & other Rice club institutions to develop a prototype for data inputs, day-to-day period tracking, & infradian rhythm & hormone charts with AWS, Flutter, & Figma.
BUT FIRST... CONTEXT...
BUT FIRST... CONTEXT...
Problem
We all know that dealing with menstruation can be a struggle. It messes with your focus, your workouts, and your mental clarity – things that young, ambitious folks rely on to chase their dreams. It's not just that; it can throw your whole routine off balance, affecting everything from your diet to your relationships to your productivity.
psy.cl was a project that I got paired with in RiceApps, a competitive software based club that builds projects from conception to deployment for the Rice community or a non-profit organization. In this case, psy.cl was an existing passion project of our PM’s, AJ!
EMPATHIZE
Understanding Our Users
Here’s what our PM aimed for the user demographic, quoting from their own customer and market opportunity blurb:
Understanding Our Users
Here’s what our PM aimed for the user demographic, quoting from their own customer and market opportunity blurb:
“Psy.cl’s beachhead market are menstruators who are motivated, hardworking, ambitious young professionals who are interested in biohacking their lives and who take days off because of the severity of pain during menstruation.”
“Psy.cl’s beachhead market are menstruators who are motivated, hardworking, ambitious young professionals who are interested in biohacking their lives and who take days off because of the severity of pain during menstruation.”
“Psy.cl’s beachhead market are menstruators who are motivated, hardworking, ambitious young professionals who are interested in biohacking their lives and who take days off because of the severity of pain during menstruation.”
“Psy.cl’s beachhead market are menstruators who are motivated, hardworking, ambitious young professionals who are interested in biohacking their lives and who take days off because of the severity of pain during menstruation.”
“Psy.cl’s beachhead market are menstruators who are motivated, hardworking, ambitious young professionals who are interested in biohacking their lives and who take days off because of the severity of pain during menstruation.”
“Psy.cl’s beachhead market are menstruators who are motivated, hardworking, ambitious young professionals who are interested in biohacking their lives and who take days off because of the severity of pain during menstruation.”
“Psy.cl’s beachhead market are menstruators who are motivated, hardworking, ambitious young professionals who are interested in biohacking their lives and who take days off because of the severity of pain during menstruation.”
Now, let’s assume that there are potential users out there who:
are in need of this app
are interested in biohacking their lives
will trust our apps and recommendations
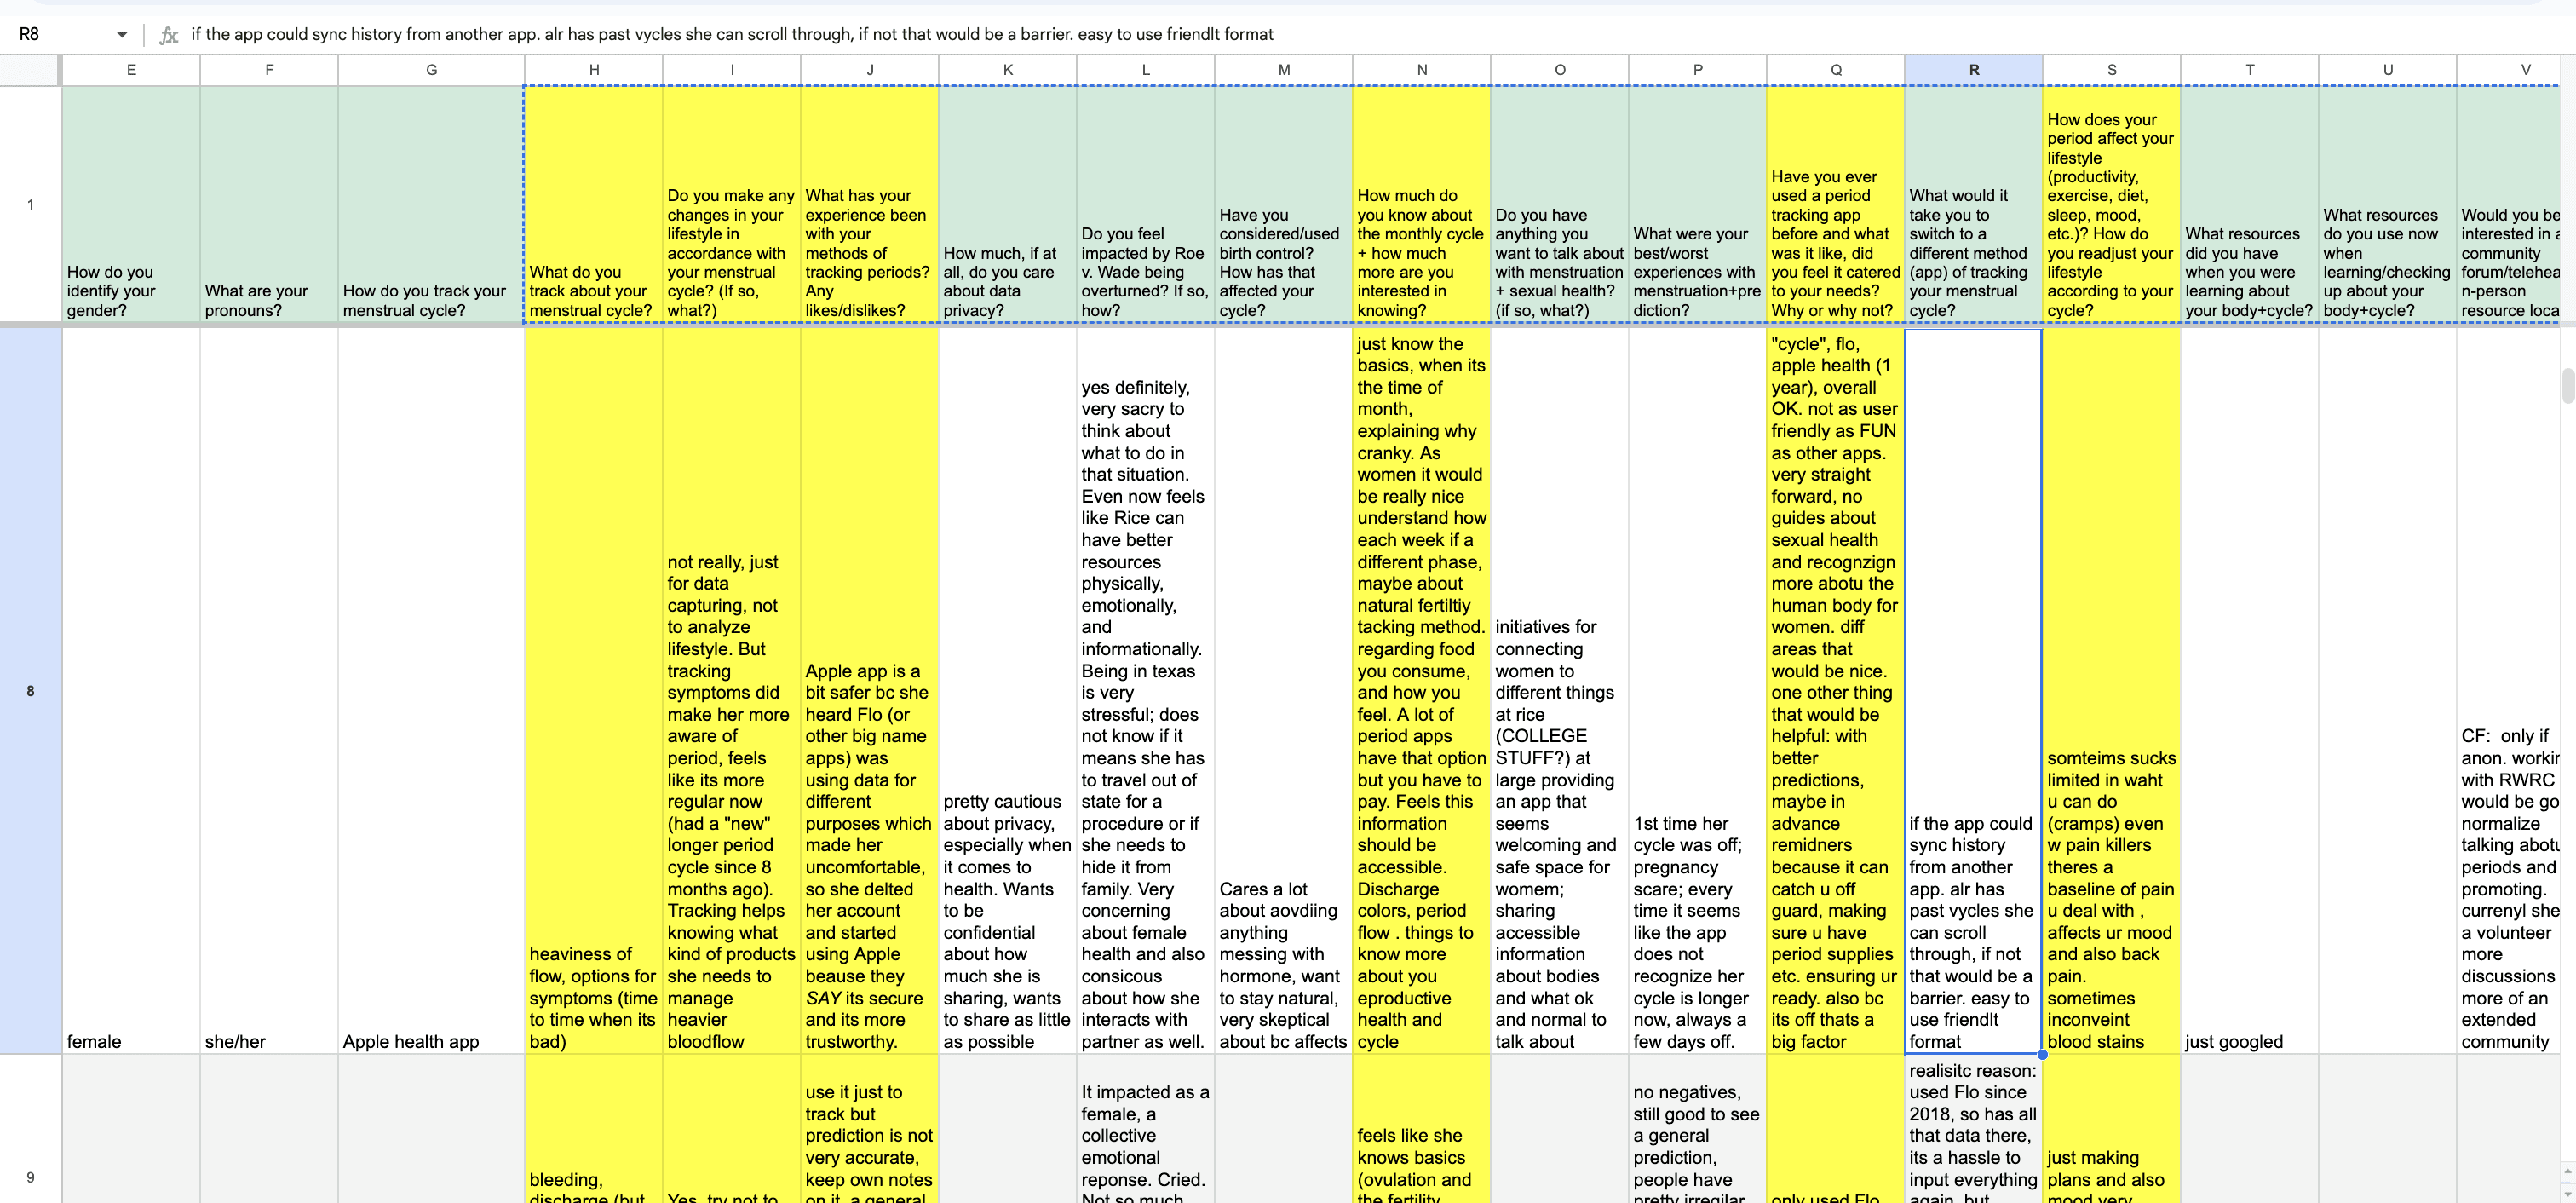
With collaboration from Rice Design For America, 16 menstruators were interviewed and contacted to help identify what the perfect period tracking app meant for them. There were a total of 18 separate questions asked (shoutout Rice DFA)... see below:
Now, let’s assume that there are potential users out there who:
are in need of this app
are interested in biohacking their lives
will trust our apps and recommendations
With collaboration from Rice Design For America, 16 menstruators were interviewed and contacted to help identify what the perfect period tracking app meant for them. There were a total of 18 separate questions asked (shoutout Rice DFA)... see below:
However, for time’s sake, I only did a deep dive on three questions I found most important, focusing on:
However, for time’s sake, I only did a deep dive on three questions I found most important, focusing on:

WHAT USERS TRACK
For tracking, what our audience tracked were incredibly diverse — covering from bleeding to cramps to mood... we did, however, notice that there were some deciding leading factors that our users preferred to track: in particular, dates and bleeding.
For tracking, what our audience tracked were incredibly diverse — covering from bleeding to cramps to mood... we did, however, notice that there were some deciding leading factors that our users preferred to track: in particular, dates and bleeding.

LIFESTYLE CHANGES
As predicted: 100% of the interviewees noted that they went through lifestyle changes in diet, exercise, productivity. Let’s break it down by category:
As predicted: 100% of the interviewees noted that they went through lifestyle changes in diet, exercise, productivity. Let’s break it down by category:

INSIGHT ON EXISTING TRACKERS
INSIGHT ON EXISTING TRACKERS
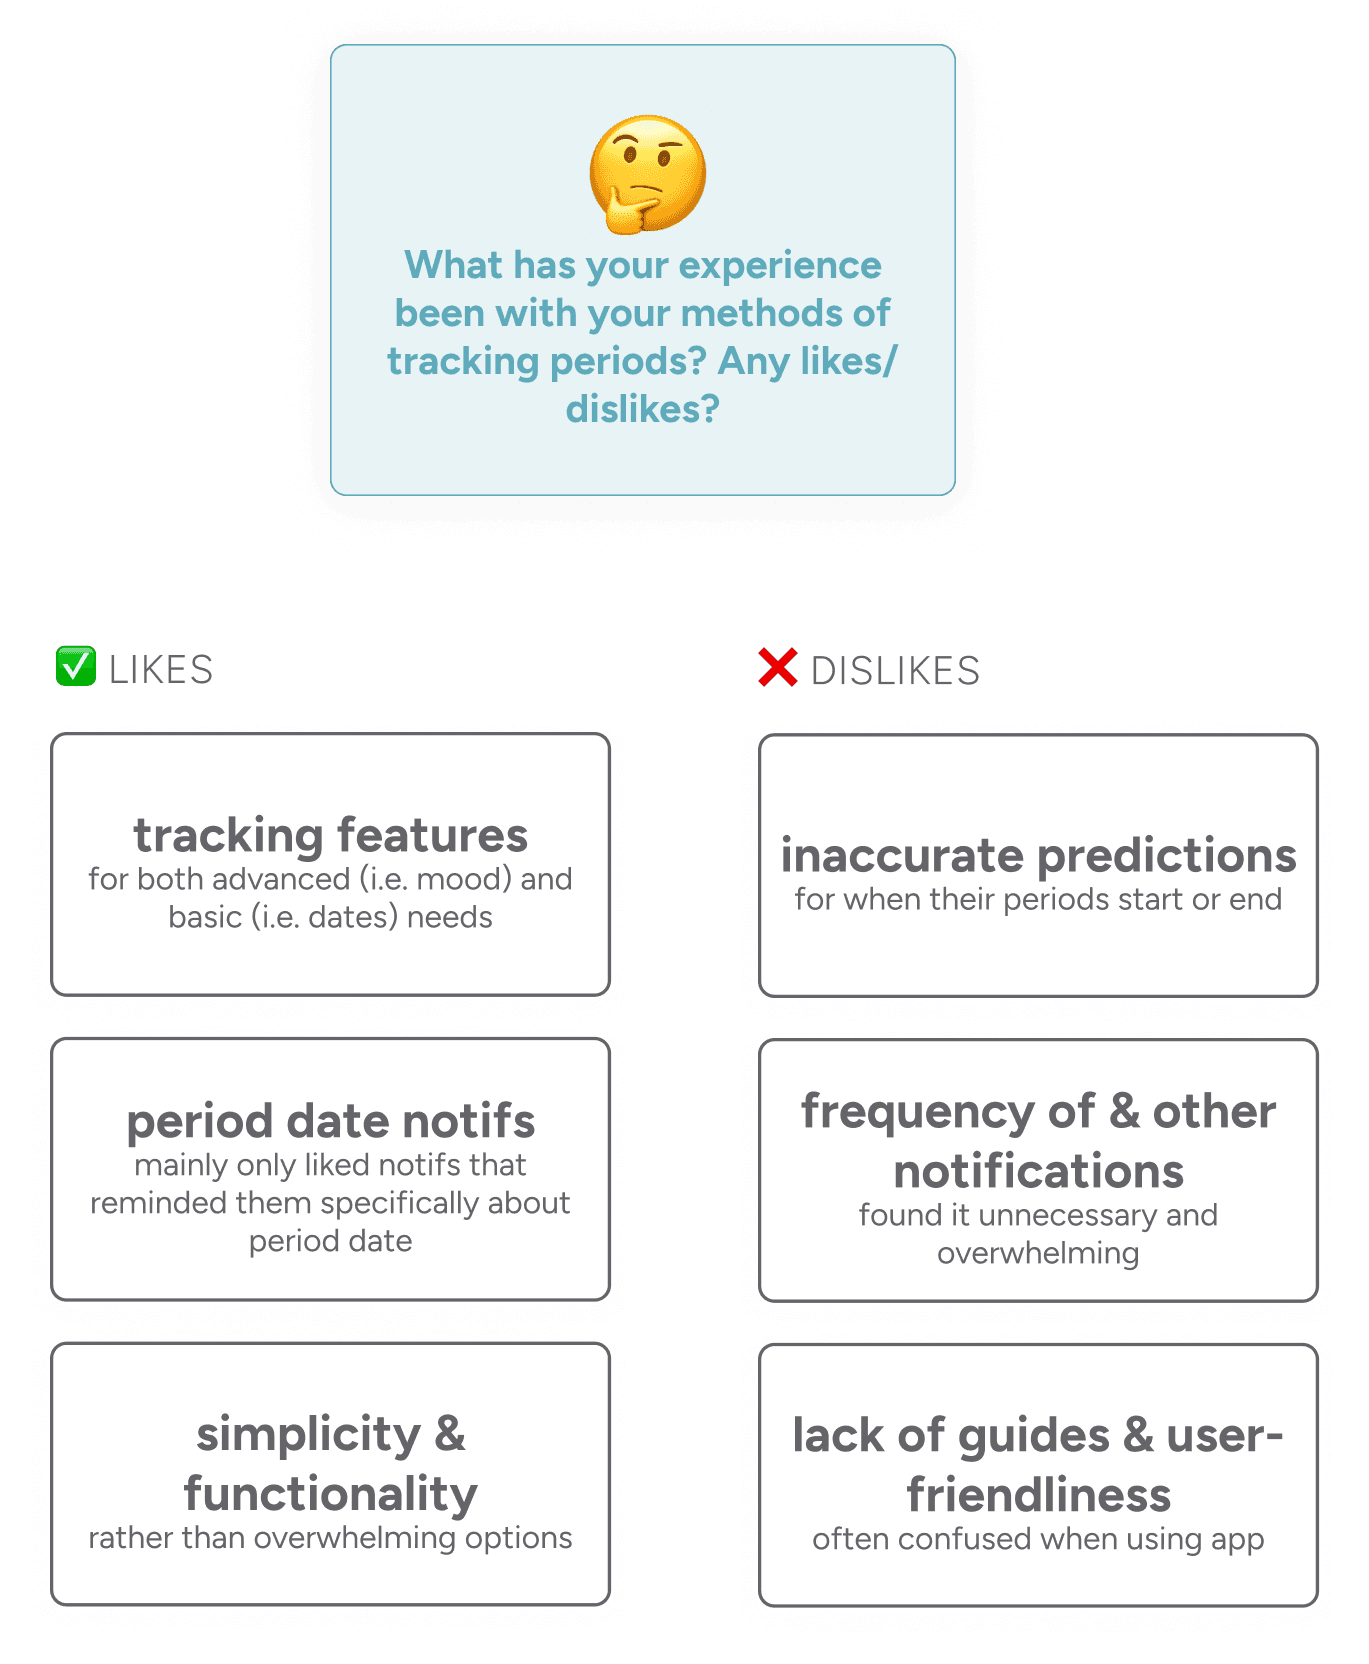
Here, I focused more on the pain points and likes from other apps that the users used (Flo, Clue, Google Excel)! Below are the main trends:
Here, I focused more on the pain points and likes from other apps that the users used (Flo, Clue, Google Excel)! Below are the main trends:
Key Features & Insights
From the research above, we rconfirmed that although users conventionally tracked only durations and bleeding, they still enjoy using other, more advanced tracking features and emphasized how their cycle introduces lifestyle changes, showing interest in psy.cl's biohacking. In addition to their needs, we found that their ideal app had user-friendly features that allows users to track easily and quickly: simplicity is key.
After taking note what our users wanted, our PM, AJ, decided to add additional features to the app that would encapsulate our users’ needs and push our developers’ designing process:

Iteration 1
For the very first iteration, I started off with a lofi wireframe: just quickly mapping out the structure and layout for our team of 8 devs to work with! Here, I made sure to include:
A progress bar noting when the period ends or starts
A calendar view to see history of period records
A chart to track hormone levels

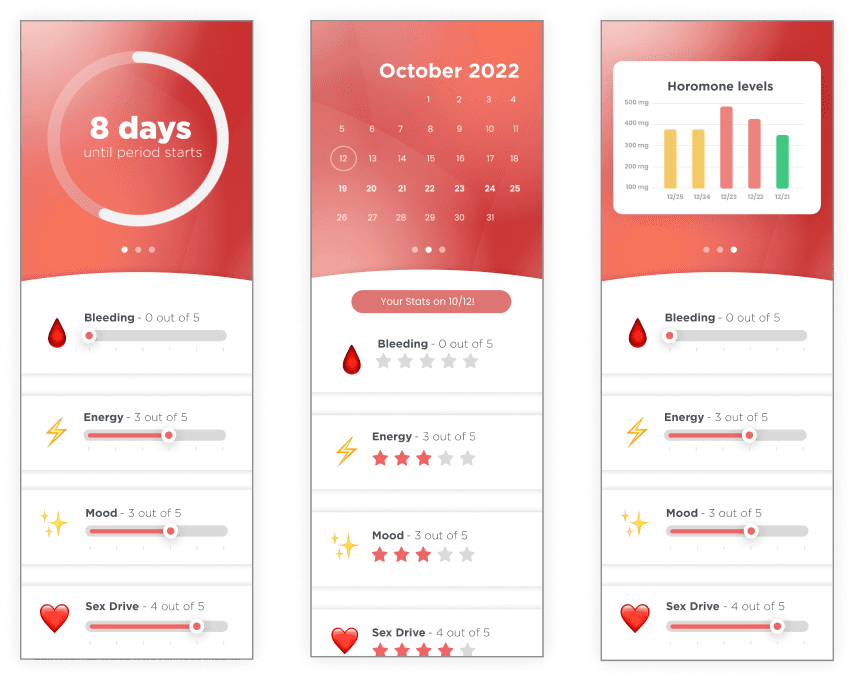
Later that week, I made a rudimentary hifi based off of the lofi above for my PMs and tech leads.
Later that week, I made a rudimentary hifi based off of the lofi above for my PMs and tech leads.
Feedback & Iteration 2
After showing the PMs and tech leads the first iteration, they kindly gave me feedback about what features they wanted to quickly change! They mentioned specifically mentioned the following:
Categorical options, not numerical.
Although they loved how clean the sliding scale feature was, this would imply that the options each section had would have to be numerical. Instead, the team wanted categorical options: for example, bleeding would have low, medium, and high, instead of “1”, “2,” ... “5.”
Graphs weren’t fit for a period app!
I added this graph from another app I had created, Purity. However, the PM mentioned that the graphs should be able to track period phases and hormone levels, not necessarily numerical stats.
I also took some creative liberty and changed some more features that they didn’t mention... see the changes below.

Iteration 3/4
Great! After having the PMs and tech leads approve of the new data collection feature, the first two wireframes were now passed on over to the devs. However, the PM still had a key piece of feedback concerning the graph:
Simultaneous view for hormone and phase tracker.
Although my lovely PM liked how the graphs were structured, she wanted users to have a way where they can track both the hormones and period phases in a single page. I would have to figure out a way to combine the two.
With that said, I went through another (rudimentary) iteration for the graph: finding a way to filter through phases, hormones, and both.
Filtering through both phases and hormones.
Here, all I did was add a top sticky bar in which users could choose which section of the graphs they wanted analytics for. I made it a priority to not change most of the layout here for the devs to make quick changes on.
However, I didn’t like this for a number of reasons... more on Iteration 4.
Iterations 4-6
Nice! We got all the features down, and my team leads (PM and tech leads) all really liked it... but I still wasn’t a big fan of the design.
After recognizing my reluctance with my own project, I decided to share with the other designers at RiceApps to see what I can improve on. Here, we agreed on the following points:
Theme and Branding
There was a consistent theme in the app up until I designed the graphs. The color scheme and layout was completely different: either choose to be consistent with the earlier UI or with the graph UI.
There’s a lot going on with the graphs!
Simply put, the graphs were too overwhelming to the people I showed. Especially after going back to DFA’s user research and recognizing that not a lot of the interviewees even wanted detailed analytics over hormones, I questioned if the bulk of the graphs were necessary.
I ended up removing the graphs feature entirely: more on that soon.
I went back to the ideating section and set on redoing both the UI and UX of the platform. This took around 2-3 iterations, but I’ll combine the iterations into a single section on this case study.
Let’s take a look:

FINAL ITERATIONS | NEW TO-DOS
Near the very end of the school year, the team decided to add a new feature for potential users to have: intelligent “recommendations” that users would be given each day that would support them throughout their cycle. They would be able to filter it through category (diet, productivity, ...).
However, as it was the end of the academic year, this project was put on hold while I was still ideating! We weren’t able to finish this iteration, but I had some very rudimentary wireframes below when I synced with the team leads:
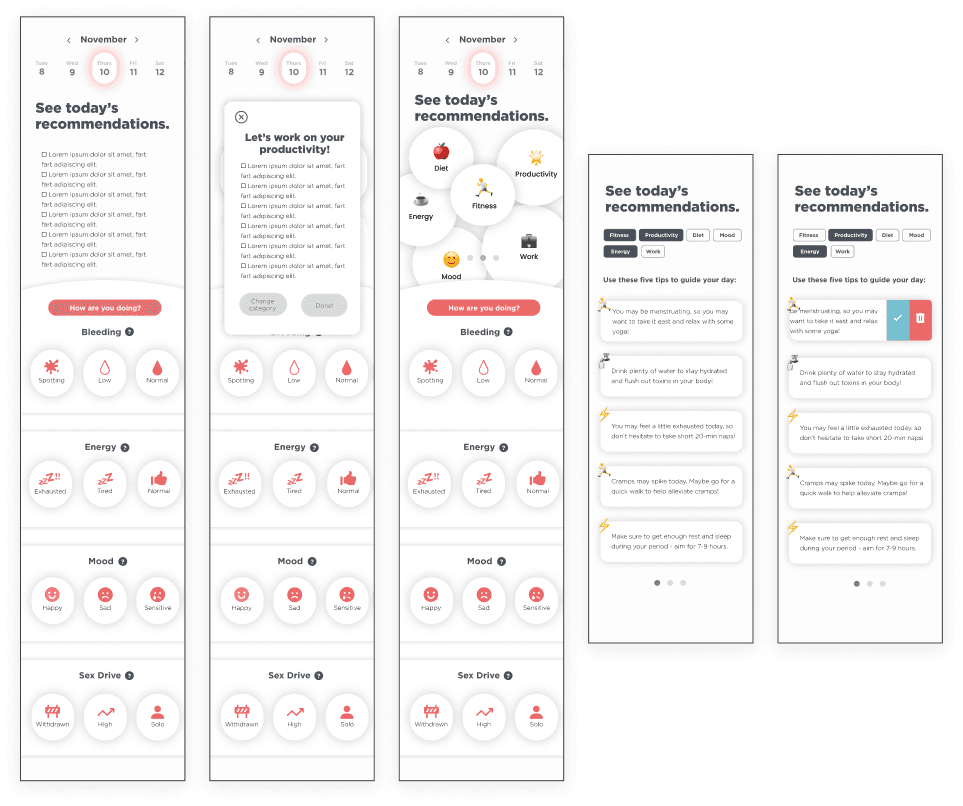
I won’t go too in detail with this feature because it wasn’t finished, but feel free to ask me how I would have designed it if I had the time!
Although we weren’t able to finish this project, the recommendations page in particular was later continued in RiceApps summer immersion program, OSA (Open Source Accelerator), and I supervised two other designers to finish this feature. More on that experience will soon be up in my portfolio!
psy.cl 🩸 :
The Prototype
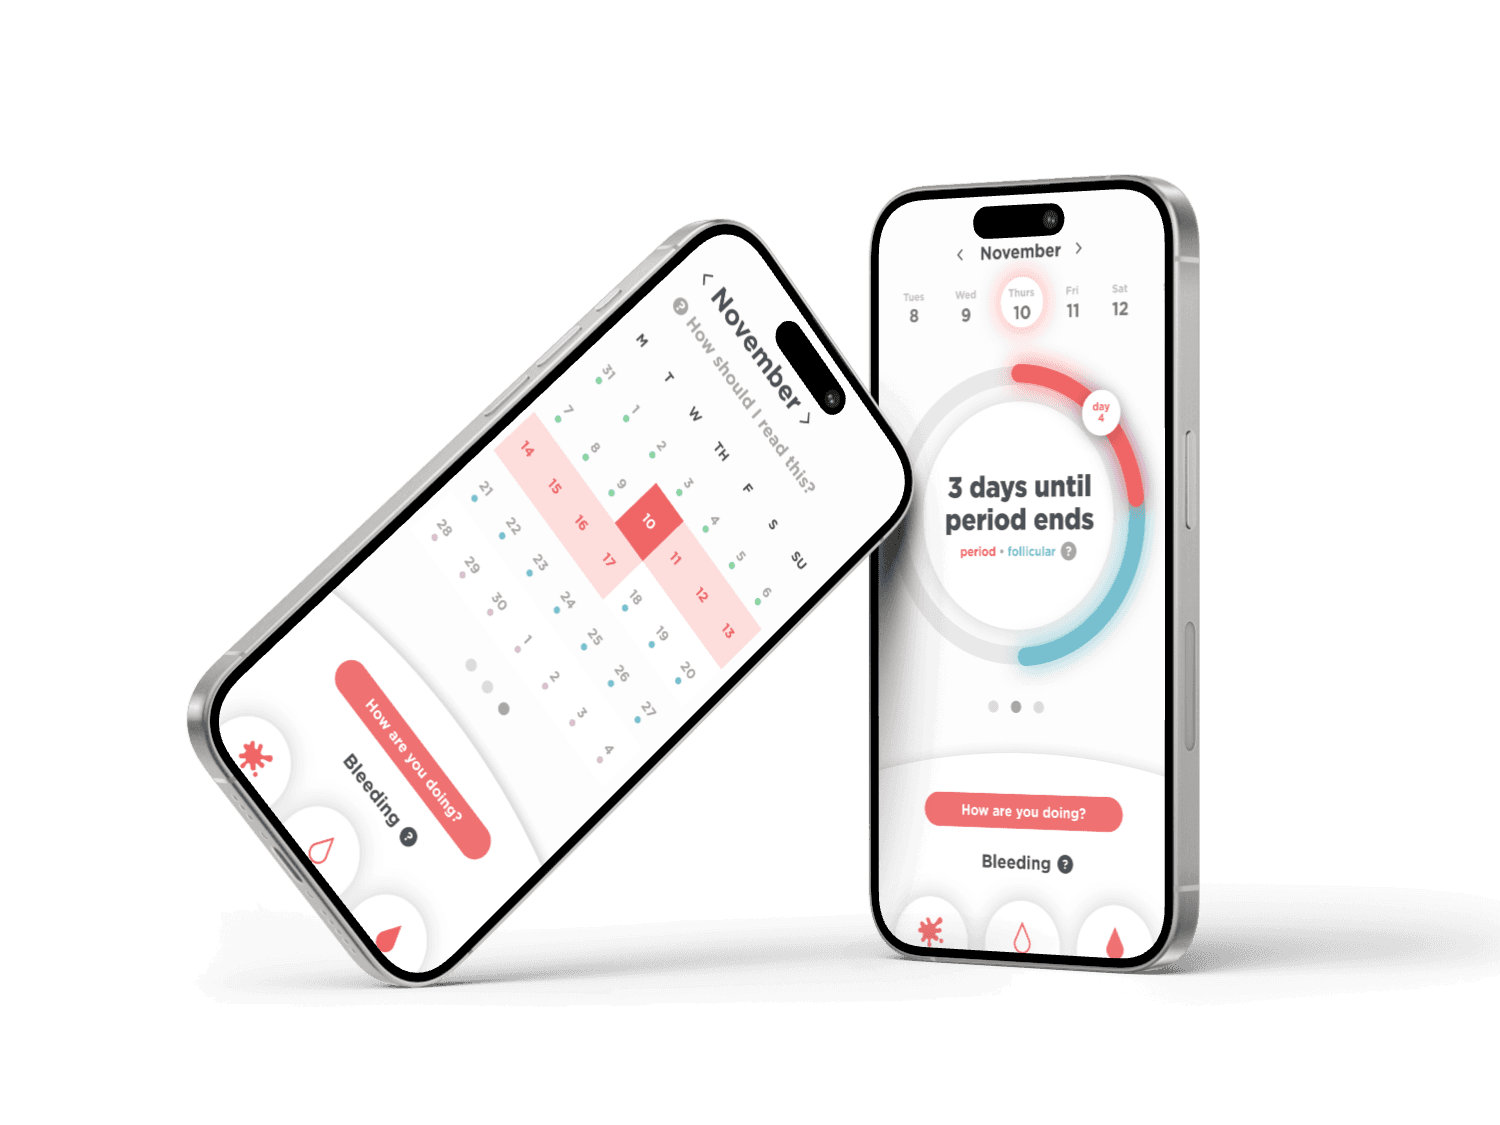
Curious over how the app turned out? Take a look here:
psy.cl 🩸 :
The Prototype
Curious over how the app turned out? Take a look here:
Progress Circle & Phases Tracker. Have the ability to not only track when your period starts/ends, but also track your different hormone phases in a visual and statistically informative way.
Calendar. Want to see your previous entries? How you felt then? What phase you were in last week? Find that all in the calendar section.
So... what did I learn?
So... what did I learn?
Having a cross-disciplinary team is amazing. This was my first project where I worked on a project with so many people... who weren’t designers! This consisted of project managers, tech leads, and other developers: I was the only designer on the team. The timeline and ideating processes for designers and for developers were widely different, which made collaboration beautiful (and tough) at times. From now on forth — as both a designer and a developer — I keep in mind what successful collaboration between design and engineering should look like.
Knowing where to find feedback. Before, I mainly relied on my PMs and tech leads — very intelligent people who don’t have design backgrounds — for advice. I had some second thoughts about my designs, but I didn’t actually change them until I checked in with other designers as well. Perspectives from each discipline are incredibly important, but I should also keep in mind where and who I should ask feedback from.
I wish I had more time for user research :(. RiceApps is a dev-focused club, so there wasn’t much of a design culture nor an emphasis on user research: we had to give designs out to the developers ASAP. Thankfully, we worked with DFA to make it happen, but user research will most definitely be a priority for my future projects.
Now, as Head Of Design at RiceApps, I make sure each designer is supported for user research and knows exactly what to do! More on that later.
© 2024 by Lucy Han. Created with this playlist on repeat ᕕ( ᐛ )ᕗ
© 2024 by Lucy Han. Created with this playlist on repeat ᕕ( ᐛ )ᕗ
© 2024 by Lucy Han. Created with this playlist on repeat ᕕ( ᐛ )ᕗ
© 2024 by Lucy Han. Created with this playlist on repeat ᕕ( ᐛ )ᕗ